Histograms are a great tool for photographers. It lets you see in graph form the exposure of you image. Histograms shouldn't be a replacement for creative genius. Depending of the circumstance you may want your image over or under exposed. These are called High Key and Low Key images and can be very stunning. Here is a chart that will help give you an idea of what your looking at when you see a histogram. A histogram is set up where the dark pixels are on the far left and gradually get lighter as you move to the right, with pure white being at the far right. (As shown by Axes 1) The amount of dark or light pixels will be shown vertically. (As shown by Axes 2.).
Now lets look at some real photos and the histograms that go with them. This first one is a picture of fireworks I took during a 4th of July Celebration. Under it you will see the histogram for this image. Do you notice how most of the information is to the left of the graph? If you were to rely strictly on the histogram it is telling you that this image is very under exposed. This is a case where you want it to be. You wouldn't see the contrast on a beautiful firework against the black sky if this was properly exposed according to the histogram.
Now lets look at another example. Here is a picture I took in my mom's garden last year. You can see from looking at it's histogram that the majority of the information is towards the right side (or the light side) of the graph. But you can tell by looking at it that it's not blown out, it doesn't matter what the histogram is telling you.
Now here is a photo that my histogram likes. (Personally, I like it too.)
See how the information is pretty even all across the graph? Now that's an example of a properly exposed image. :-)
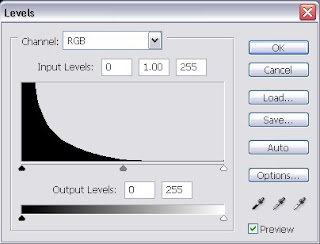
Now here is the shocker. You've just listened to me say over and over not to listen to the histogram and trust your eye and creative genius. I use histograms all the time. They do have a purpose. I use them most often in Photoshop to correct the exposure of images that I think are under or over exposed. (Not with creative intent.)
As you can see most of the data is on the left half of this histogram showing that it is underexposed. In this instance I want to lessen the gape between the light and dark pixels. To do this I'm going to click on the slider on the right and drag it to the left stopping where the information in the graph starts.
This is the resulting image. Much better I think. Another way to use your histogram is right on your camera. There are some situations where you might be shooting and can't trust the thumbnail on the LCD to tell if your image is properly. Such as if you are shooting in bright sun you may not be able to see by looking at your LCD screen if the image is over or under exposed. This is a great time to utilize your histogram. In fact, I don't think there is a bad time. Just as long as you don't take what it's telling you as gospel.
Note: When an area of your photo is extremely over expose you will see a tall thin line way to the right of the graph. When an image is severely over or under exposed it results in lost data. This data can't be recovered by playing with Levels in Photoshop. Keeping an eye on your histogram will keep accidental spikes in the light or dark areas resulting in lost data.


I dont have this program but I have one that has an HDR ish setting. I have used it on a few pics but I think the nature outside shots look really nice that way.
ReplyDelete